Experiment 8: Calorimetry
Different substances require different amounts of energy (in the form of heat) to raise their temperatures to a certain level. For example, adding 1000 J of heat to oil wouldn't raise the oil's temperature as much as it would raise the temperature of an iron bar of the same mass with the same amount of heat. This property for a substance to thermally respond to an inflow of energy is called heat capacity. All the factors contributing to how well a substance responds to the gain or loss of heat energy can be expressed in a simple and elegant equation.

Where Q is the amount of heat involved when concurring a temperature change of T, m is the mass of the substance involved, and C is the substance's specific heat. In this experiment, we will be using calorimetry - a method to experimentally derive the specific heats of the substances in question. Namely, an aluminum bar and a copper bar.
Calorimetry involves the use of two other additional equations. One, being
where Q is the heat added to the calorimeter, T is the temperature change that its system undergoes, and C is its heat capacity, which is commonly referred to as the calorimeter constant. The last one is basically a restatement of the law of conservation of energy, wherein
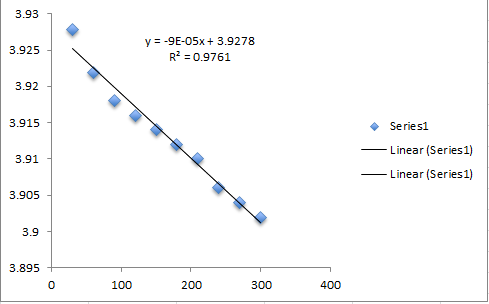 |
| Figure 1: Calibration Curve of Trail 3 |
With the necessary data collected, the Calorimeter constant was obtained. This was done for two other trials. The three calorimeter constants were then averaged, obtaining an experimental value of 91.9528694 J/g°C.
The second part of the experiment aimed to obtain the heat capacities of two different metal bars; copper and aluminum. In order to do this, both bars were heated to 100°C then placed in 200 mL of water in the calorimeter. The necessary data was gathered, then using the same equations, the specific heats of the two metals were obtained.
The values were found to be:
Copper - 0.43957641 J/g°C
Aluminum - 0.51007307 J/g°C
Compared to their known values, the result for copper exhibited a 13.89% error. Meanwhile, Aluminum's results showed a 43.33% deviation. Many aspects of the way the experiment was carried out were prone to error. One such factor could be the crude nature of the calorimetry set up (styrofoam cups, cold air leaking into set up), which would ultimately affect the accuracy of the results. Another could be the fact that a lot of the experiment involved things that needed immediate or even instantaneous measurement. However, since actions such as mixing two water sources took time, the required data was not able to be measured as quickly as needed. Nonetheless, with already such a crude setup, the deviations were not as far as expected, making percent errors as high as 43.33% relatively satisfactory.
Sources:
[1] "Experiment 8: Calorimetry." Physics 103.1 Experiment Manual. N.p.: n.p., n.d. N. pag. Web. 22 Apr. 2016.
Sources:
[1] "Experiment 8: Calorimetry." Physics 103.1 Experiment Manual. N.p.: n.p., n.d. N. pag. Web. 22 Apr. 2016.
No comments:
Post a Comment